We are building an end-to-end narrative reporting system to parse, analyze, and generate multimodal narrative reports from communication datasets. Primarily, we are working with the Enron and Avocado email collections. We are looking at the problem of providing intelligent interfaces for analysts to quickly and meaningfully understand patterns and anomalies in large collections of emails (250k to 1M). To solve this problem we are integrating state-of-the-art natural language processing, communication analysis, and interactive visualization techniques.
The research goals of this project include characterizing the usefulness of specific interactive visualizations for data filtering and query specification on large datasets (e.g. Graph visualization, time-series visualization, scatter plots, histograms, animations in visualizations).
Details
The overarching theme of the system is to integrate natural language processing of individual messages with a communication model over the participants. The textual analysis applies state-of-the-art techniques to email content in order to compute verbosity, topic, sentiment, and other features. We also develop our own methodology to label emails with the communicative intent (e.g., inform, request, respond). At the next level, the system applies clustering and other graph analysis techniques to the communication graph.
Combining all these components we then compute models for individuals, clusters, and datasets. These models yield a measure per-email indicating how typical a message is for a user. These models give the amount of anomalous activity per-day which is then used to predict significant events from the corpus.
All this information will be presented to the analyst in a mixed-initiative AI-assisted workflow. This includes textual summarization and visual artifacts.
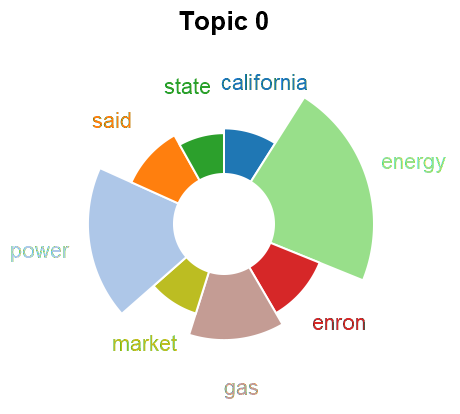
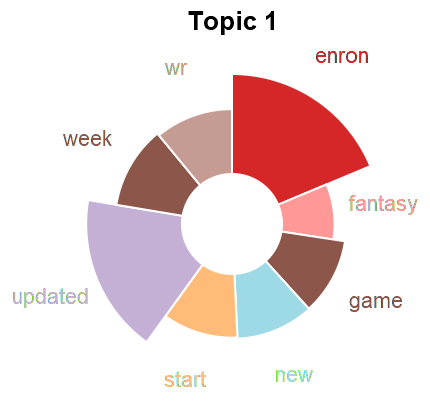
Topic Models
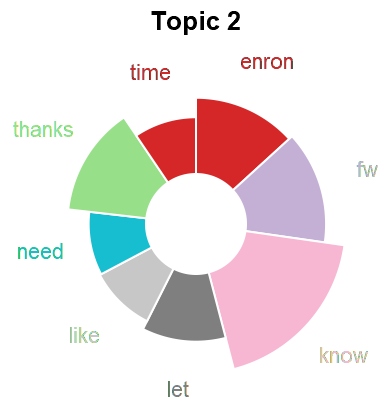
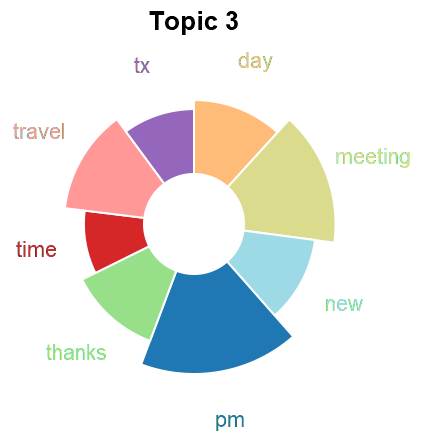
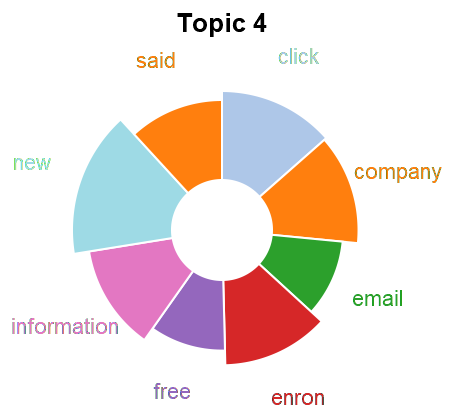
Topic analysis if one of the analysis dimensions we consider in a dataset. We use this both for summarization and to detect content shifts over time (which informs the event detection). We use both LDA and doc2vec based approaches. To better understand the differences in these approaches we consider how to embed LDA topics into an embedding space (such as the one given by doc2vec).
We begin by training LDA on the target dataset and identifying keywords for each topic. In parallel, we train doc2vec on a reference corpus (which would be the same as the target corpus). Next, we infer the embedding of each document in the target dataset and use a clustering algorithm to get topics. Once we have topics from each method, we then calculate the embedding of the LDA topics.
- Keywords to Vectors. For each of the top keywords for a topic, we get the corresponding vector representation in the embedding space. The topic embedding is then the (weighted or unweighted) average of these vectors.
- Documents to Vectors. For each document associated with a topic, we compute the (weighted or unweighted) average and use that as the topic embedding.
To evaluate these embeddings, we evaluate whether a topic subdivides the document vectors from doc2vec in a reasonable way. The first metric we use is to compute the pairwise cosine similarity of LDA embedding.
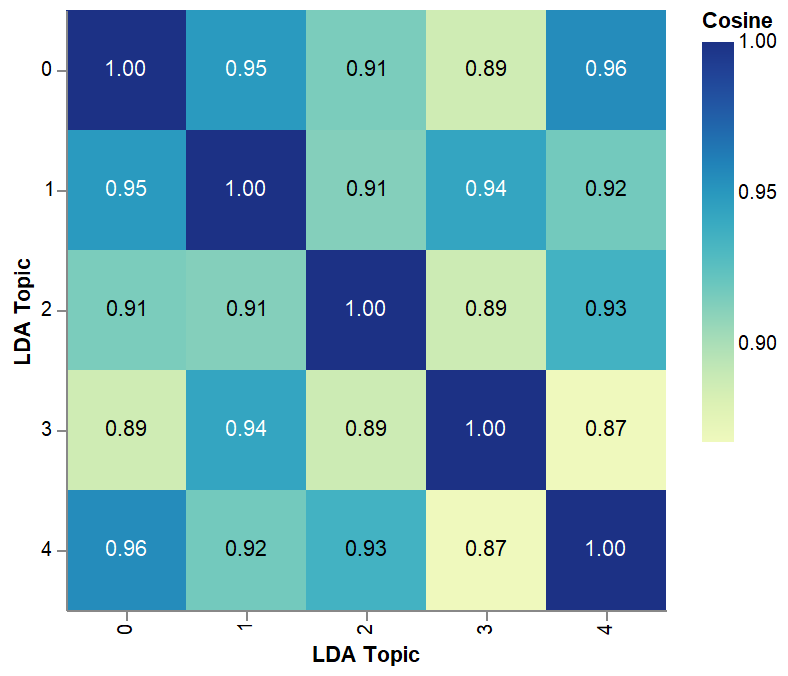
After evaluating the embeddings on their own, we compare those embeddings to the clusters generated directly from the doc2vec space. For clustering techniques based on a center (such as k-means), we can again use pairwise cosine similarity between LDA embeddings and cluster centers.
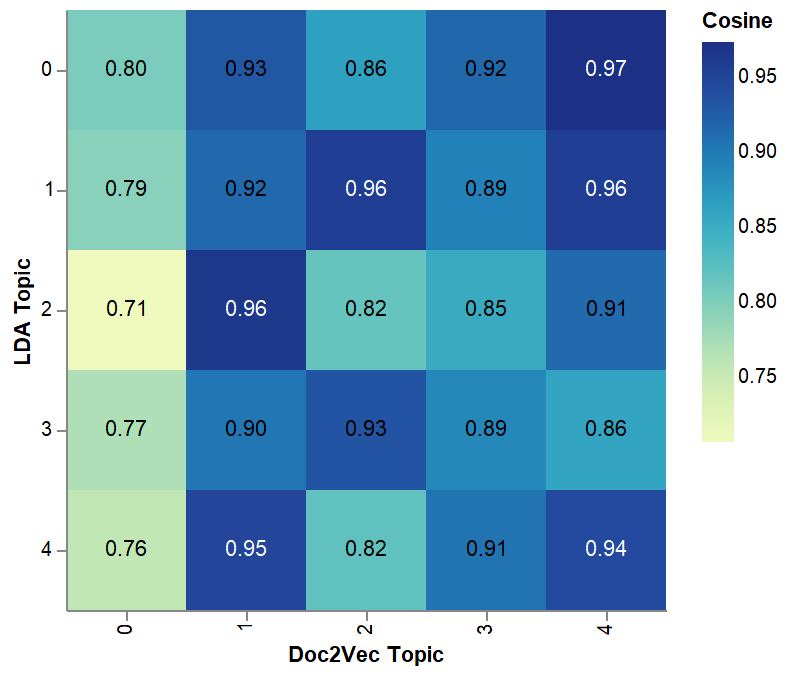
Finally, we calculate the number of documents categorized into each topic pair (one from LDA one from doc2vec). This can either be weighted (such as the LDA probability of a topic) or unweighted (such as the nearest topic vector).
TODO: Figure (matrix member of LDA vs doc2vec topics)
Artifacts: Reports, Visualizations, and Interactions
The system generates multimodal narrative reports which contain summarization of the datasets in terms of communication. This includes topics, people, events, and other anomalies. The output falls into the storytelling with data paradigm. We attempt to generate compelling, accurate, and useful visual elements for reports. This includes corresponding text and placement to fit the overall report narrative.