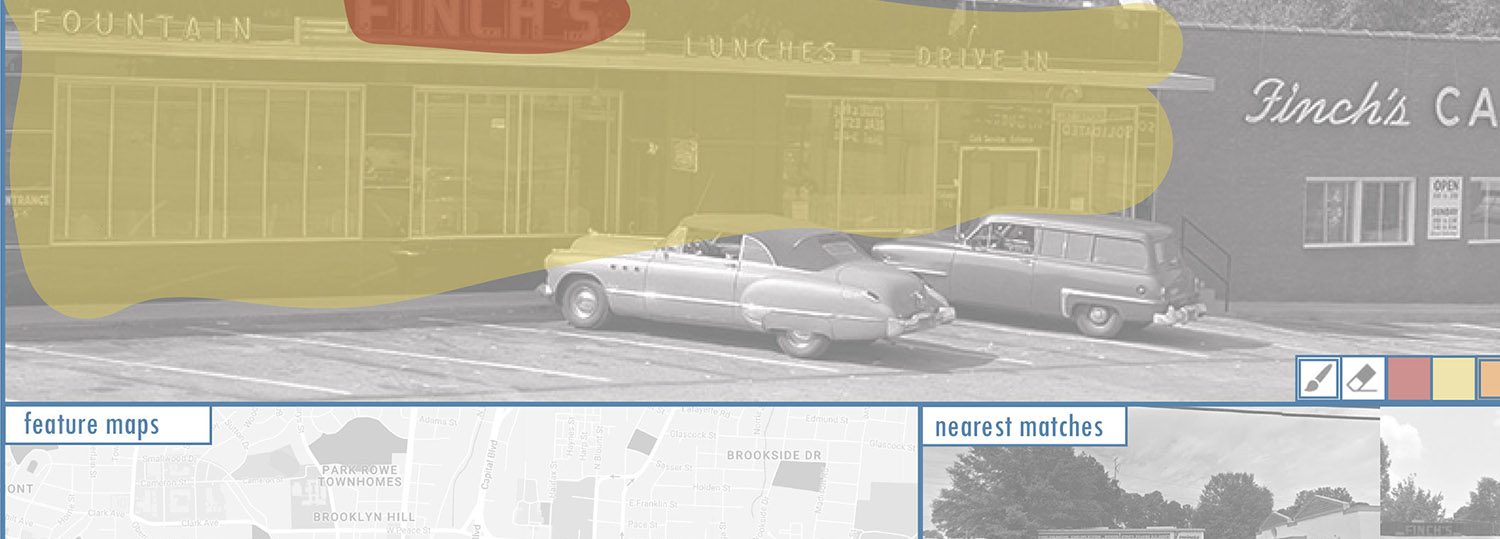
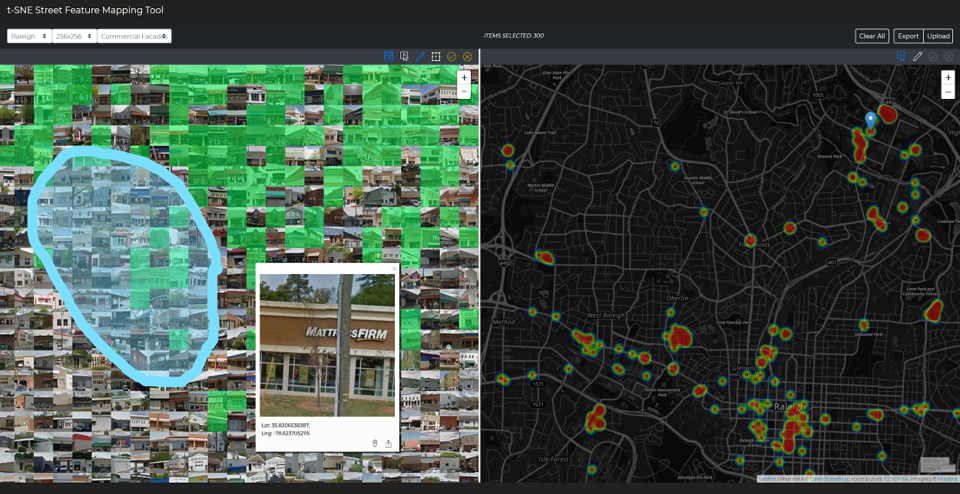
In the last two decades, historians have increasingly employed GIS to understand urban and spatial change. However, GIS approaches landscapes from above, reproducing the point of view of the planner. The Urban Panorama Project aims to introduce a new dimension in the historical assessment of how cities change. By shifting the focus from geometric parcels, as seen from the air, to images of streetscapes, as seen at the street level, we intend to move closer to the perspective of the people experiencing change in the space of the city as they traverse its streets and avenues. The Urban Panorama Project, therefore, is testing different computer vision and machine learning techniques to assess historical and present-day images of streetscapes to investigate urban change. One of these techniques is exemplified in our Street Feature-Location Mapping Tool. The tool allows the visualization of clusters of tens of thousands of building facades, or other desired street-level visual features, scraped autonomously from geolocated street-level photographic corpora. The system leverages two popular machine-learning techniques and open source software libraries. The first, YOLO, is a neural-network-based computer vision object detection system. We are able to train desired image classifiers (e.g. what does a building facade, commercial sign, or mailbox, etc. look like), by providing hundreds of example annotated images. Such classifiers are then used to autonomously mine photographic archives and extract these features (and their associated geo-location/temporal metadata), depositing the results in a database. The second, t-SNE (t-distributed stochastic neighbor embedding), is a machine learning technique for dimensionality reduction, useful for visualizing high-dimensional datasets. Unlike YOLO, it does not require human training—in our case we used the t-SNE technique to analyze all images in a particular feature corpus—i.e., all building facades, etc.—and autonomously cluster visually similar images together in a spatial plot. In this presentation, we will present the tool and its application to a corpus of geolocated historical (1920-1980) and present-day streetscape images of Raleigh, NC. The tool uses an intuitive thumbnail grid interface where features are selectable and visualized as a heatmap layer in an adjacent city map. The Street Feature-Location Mapping Tool will help researchers within the Urban Panorama Project to use historical streetscape images to understand the spatial distribution of urban features across the space of the city. With the development of this tool, we can tap into corpora of street-level historical images to understand the spatial distribution of streetscape features in a city and compare different time periods. Phenomena such gentrification, urban decay, the spread of architectural styles, the use of different materials, textual analysis of urban signs, social uses of public space, urban flora, etc. could be mappable through this technique.
There are a number of projects which either conceptually or technically influenced the development of the Street Feature-Location Mapping interface. Significant among these are the experiments developed in the MIT Medialab Camera Culture Lab—StreetScore and StreetChange. Each of these projects leverages the street-level, multi-year photographic archives of Google StreetView and common machine learning techniques to geospatially map predictive ratings of perceived pedestrian security, and urban change. The systems allow the researcher to leverage “big visual data” to potentially extrapolate/extricate interesting narratives about urban space, the constructed environment, and the lives of the communities living therein.
In the digital humanities realm, projects such as the Yale DH Lab PixPlot, and the Google Experiments projects t-SNE Map and Curators Table, use unsupervised machine learning classification and dimensionality-reduction techniques such as t-SNE or UMAP, to develop 2D/3D cluster visualizations of large-scale image datasets (historic photographs, artwork, etc.), affording interesting browsing, exploration and analysis of patterns, densities and adjacencies.
We leverage a number of these mentioned techniques and modalities, to create a novel, hybridized interface, based on two panels—on the left, a cluster mapping space, on the right, an online map of the city in question. The cluster panel shows a grid-based 2-d representation of the cluster image field for a particular feature, e.g., building facades. The user selects individual images, or regions in the image grid on the left, which are then mapped in the geo-spatial map on the right. Correspondingly, regions may be selected in the geospatial map, say a city block or neighborhood, which highlights clusters in the image feature grid, or allows the user to prune feature selections. The back and forth between these two mapping panels allows rich exploration and discovery potential. Interface selections may be saved for future use. Additionally, the cluster panel may have multiple tabs to navigate and select a variety of classes of features, e.g., building facades, doors, vehicles, etc. The composite selection is geospatially mapped with densities of overlap visualized via heat mapping.
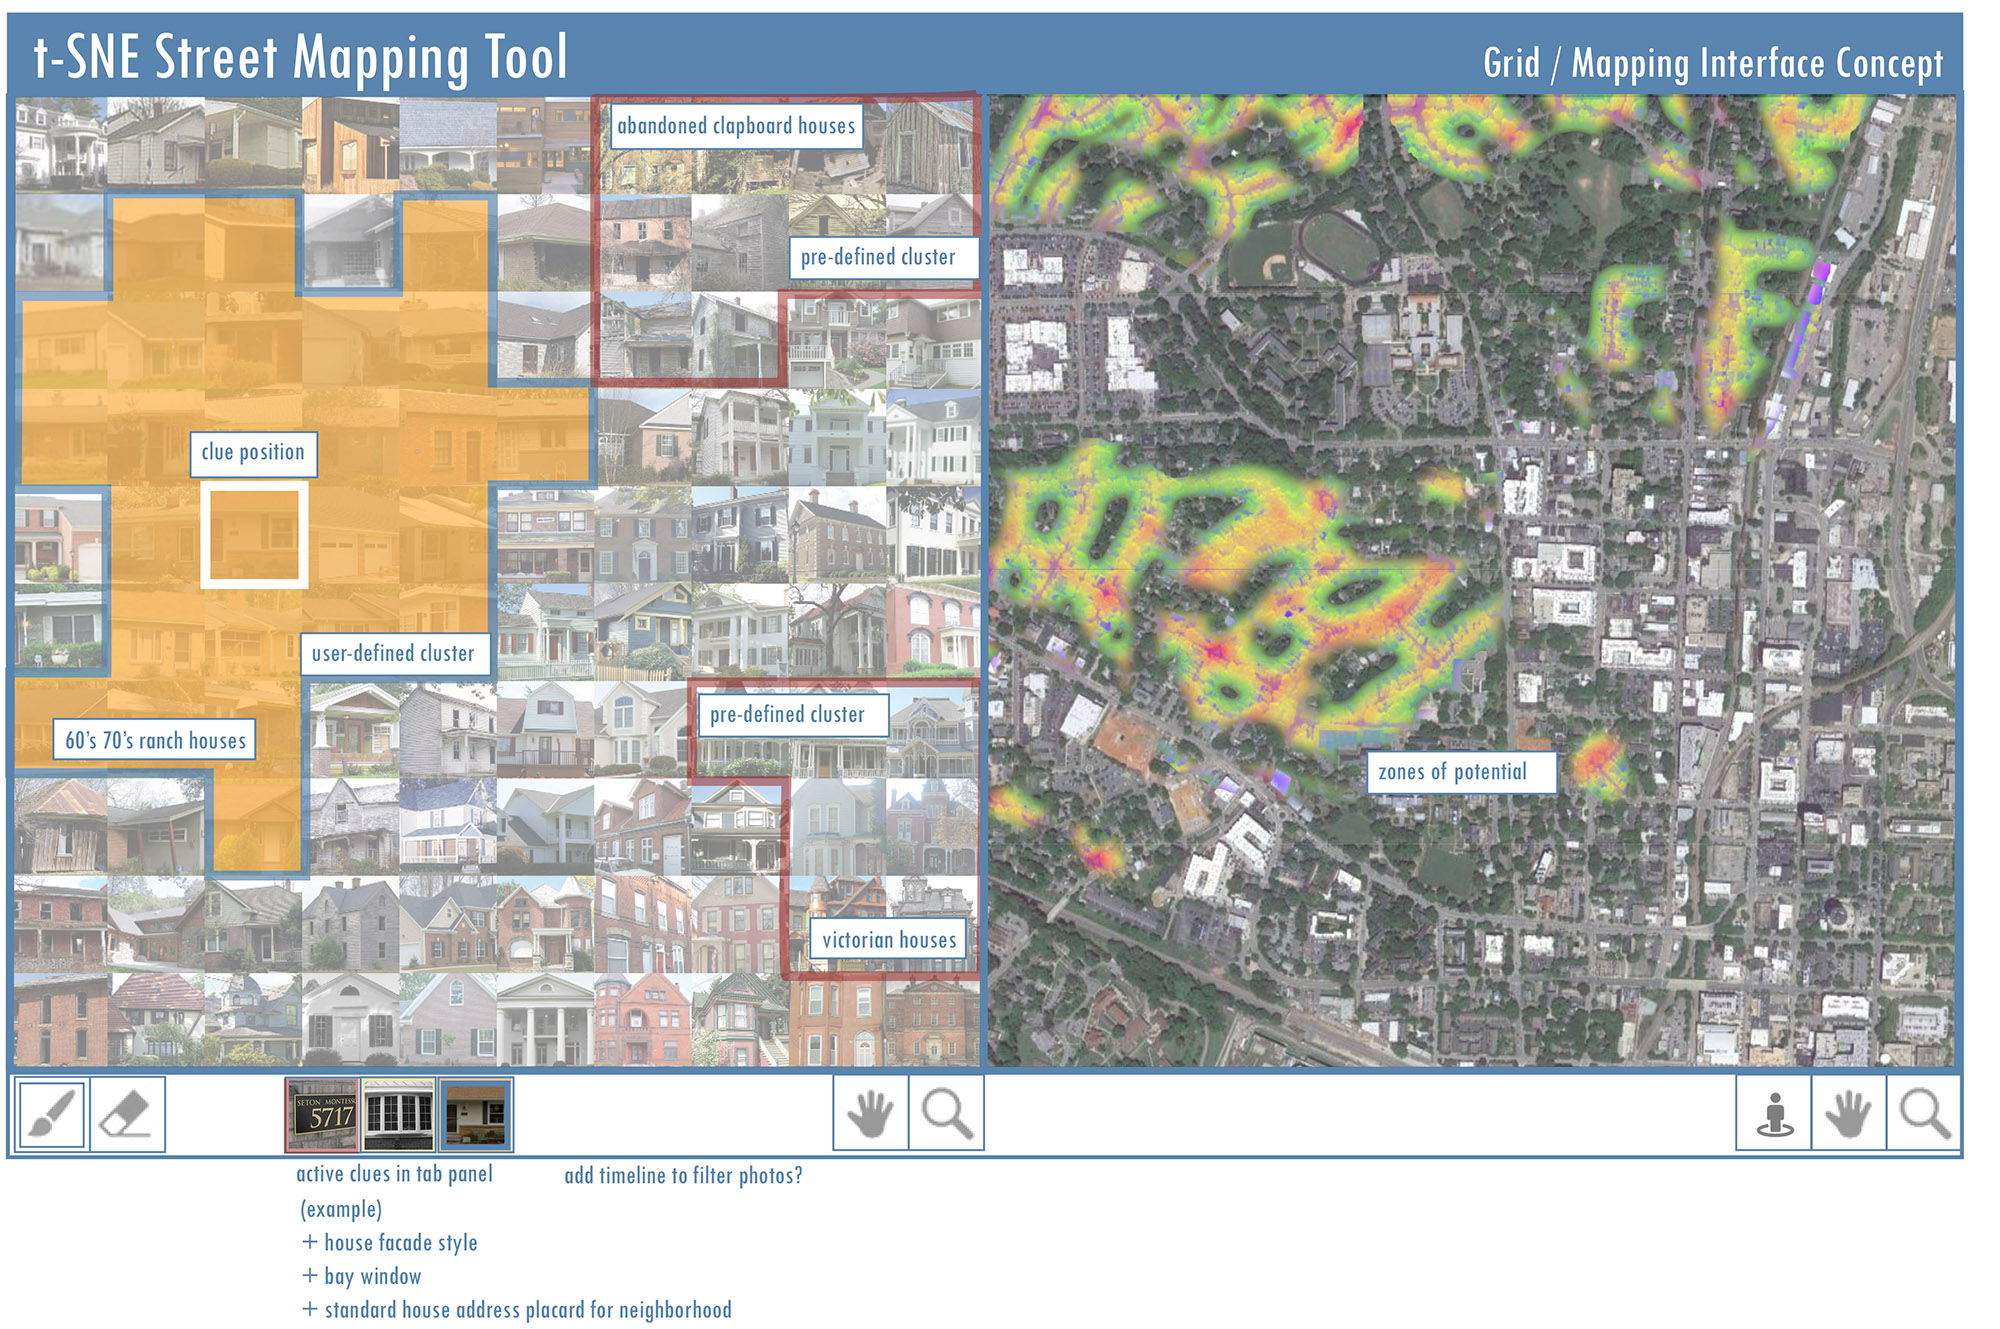
Dimensional reduction techniques such as t-SNE are useful for autonomously exploring large corpora of urban street-level imagery. For example, without training it can roughly begin to cluster building facades into groupings which suggest architectural style or usage. Initial experiments our Raleigh dataset found clusters of Victorian, Neoclassical and Modern buildings, functional categories like skyscrapers and strip malls, oddities such as houses with white-picket fences, and even begin to cluster abandoned/dilapidated buildings. The clustering is not perfect—these techniques are black-boxes, and as much of an art as a science. They require designing interfaces which keep a human in the loop, to begin to organize, cull, or reconfigure the tools and datasets to tease out useful patterns.
The specific street-level features extracted and visualized were dependent on the type of questions we wanted to answer. Our initial experiments focused more on the broad applicability of the tool. We started with course grain features; we trained YOLO, using the Imagenet image database (which provides a crowd-sourced categorized corpus), to detect and extract buildings, people, vehicles, and signs from Google Street View photospheres (initially from a 25 sq. mi. region of Raleigh). From here we are initially focusing on extracting/identifying more granular features within the architectural space.

Principal Investigators
- Frederico Freitas, Assistant Professor, History (NCSU)
- Tianfu (Matt) Wu, Assistant Professor, Electrical and Computer Engineering (NCSU)
- Todd Berreth, Assistant Professor, Art and Design (NCSU)
- Arnav Jhala, Associate Professor, Computer Science (NCSU)
Current and Past Research Assistants
- Stephanie Lee Huang, Art + Design (NCSU)